Novel Methods to Explore Building Energy Sensitivity to Climate and Heat Waves Using PNNL's BEND Model
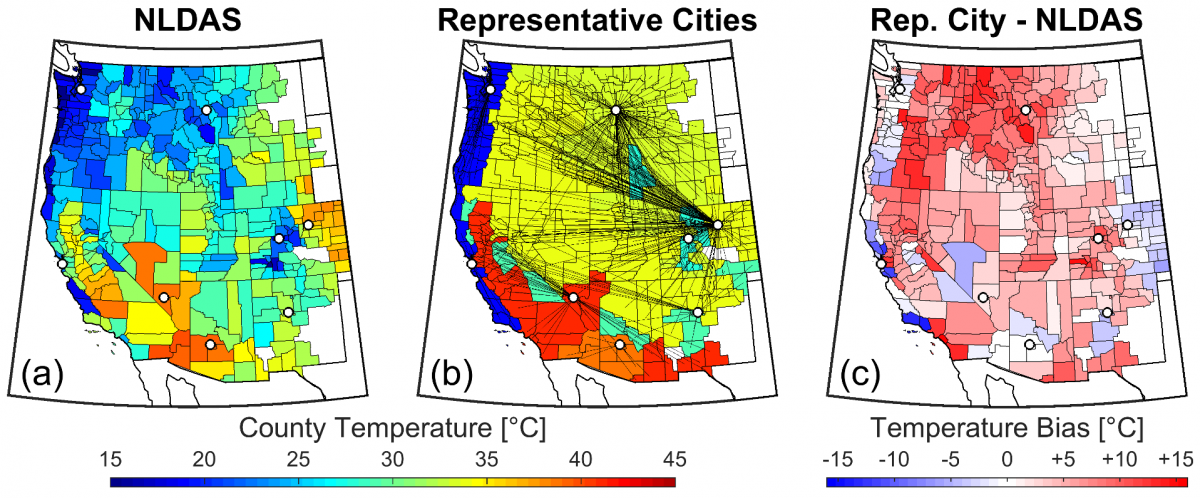
The DOE's Pacific Northwest National Laboratory (PNNL) has been developing the Building ENergy Demand (BEND) model to simulate energy usage in residential and commercial buildings responding to changes in weather, climate, population, and building technologies. At its core, BEND is a mechanism to aggregate EnergyPlus simulations of a large number of individual buildings with a diversity of characteristics over large spatial scales. We have completed a series of experiments to explore methods to calibrate the BEND model, measure its ability to capture interannual variability in energy demand due to weather using simulations of two distinct weather years, and understand the sensitivity to the number and location of weather stations used to force the model. The use of weather from “representative cities” reduces computational costs, but often fails to capture spatial heterogeneity that may be important for simulations aimed at understanding how building stocks respond to a changing climate (Fig. 1). We quantify the potential reduction in temperature and load biases from using an increasing number of weather stations across the western U.S., ranging from 8 to roughly 150. Using 8 stations results in an average absolute summertime temperature bias of 4.0°C. The mean absolute bias drops to 1.5°C using all available stations. Temperature biases of this magnitude translate to absolute summertime mean simulated load biases as high as 13.8%. Additionally, using only 8 representative weather stations can lead to a 20-40% bias of peak building loads under heat wave or cold snap conditions, a significant error for capacity expansion planners who may rely on these types of simulations. This analysis suggests that using 4 stations per climate zone may be sufficient for most purposes. Our novel approach, which requires no new EnergyPlus simulations, could be useful to other researchers designing or calibrating aggregate building model simulations – particularly those looking at the impact of future climate scenarios.