
Leveraging Extremal Dependence to Better Characterize the 2021 Pacific Northwest Heatwave
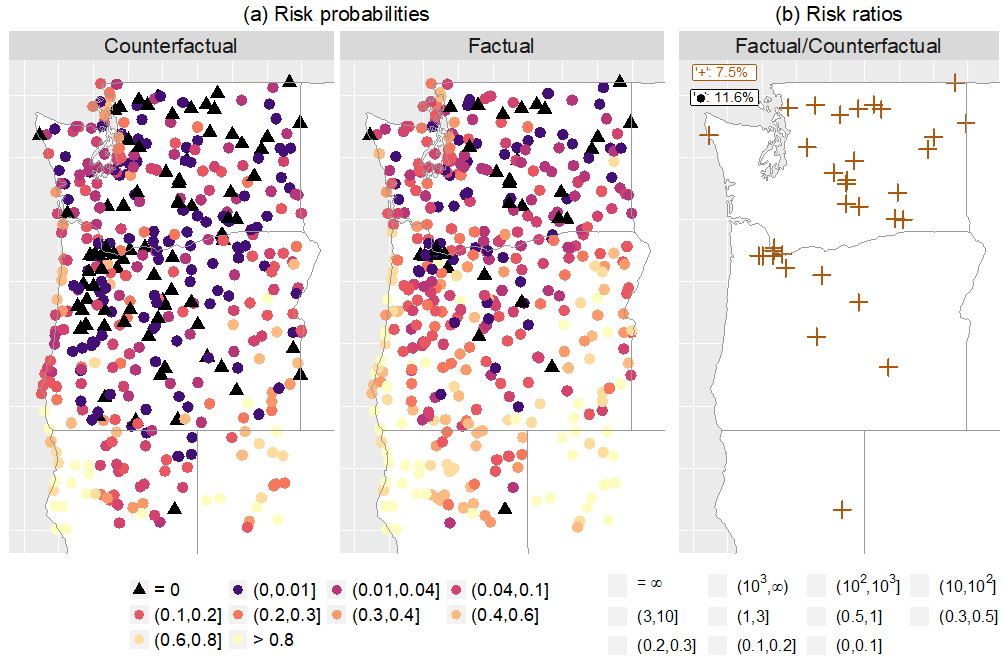
These maps show the probability of experiencing temperatures as extreme as those from the 2021 heatwave with (“factual”) and without (“counterfactual”) anthropogenic climate change as well as their ratio (right panel). Pink colors indicate that human-induced warming caused the heatwave to become more likely.
Image courtesy of Likun Zhang
Researchers assessed how methodological choices led to zero-probability estimates for the extreme temperatures that occurred in the United States Pacific Northwest during the devastating heatwave in the summer of 2021. When properly accounting for year-to-year variability in extreme temperatures and the spatial coherence of individual heatwave events, it is possible to assign non-zero probability estimates to heatwave events as or more extreme than the one in 2021. In most cases, anthropogenic climate change made extreme temperatures more likely than in a world with greatly reduced greenhouse gas emissions.
Prior to our study, it was believed that the 2021 PNW heatwave “broke” statistical methods, since the observed temperatures were larger than data-driven estimates of the hottest possible temperatures in the region. Our analysis shows that this is not true – when better accounting for the spatial extent of individual extreme events, we can anticipate 96% of the heatwave temperatures recorded during the heatwave. More accurately estimating probabilities of the observed temperatures furthermore allowed us to construct attribution statements to quantify the human influence on the rarity of the heatwave.
In late June, 2021, a devastating heatwave affected the US Pacific Northwest and western Canada, breaking numerous all-time temperature records by large margins and directly causing hundreds of fatalities. The observed 2021 daily maximum temperature across much of the U.S. Pacific Northwest exceeded upper bound estimates obtained from single-station temperature records even after accounting for anthropogenic climate change, meaning that the event could not have been predicted under standard univariate extreme value analysis assumptions. In this work, we utilize a flexible spatial extremes model that considers all stations across the Pacific Northwest domain and accounts for the fact that many stations simultaneously experience extreme temperatures. Our analysis incorporates the effects of anthropogenic forcing and natural climate variability to better characterize time-varying changes in the distribution of daily temperature extremes. We show that greenhouse gas forcing, drought conditions, and large-scale atmospheric modes of variability all have a significant impact on summertime maximum temperatures in this region. Our model represents a significant improvement over the corresponding single-station analysis, and our posterior medians of the upper bounds can anticipate more than 96% of the observed 2021 high station temperatures after properly accounting for extremal dependence.