U.S. flag

An official website of the United States government

Publication Date
1 September 2015

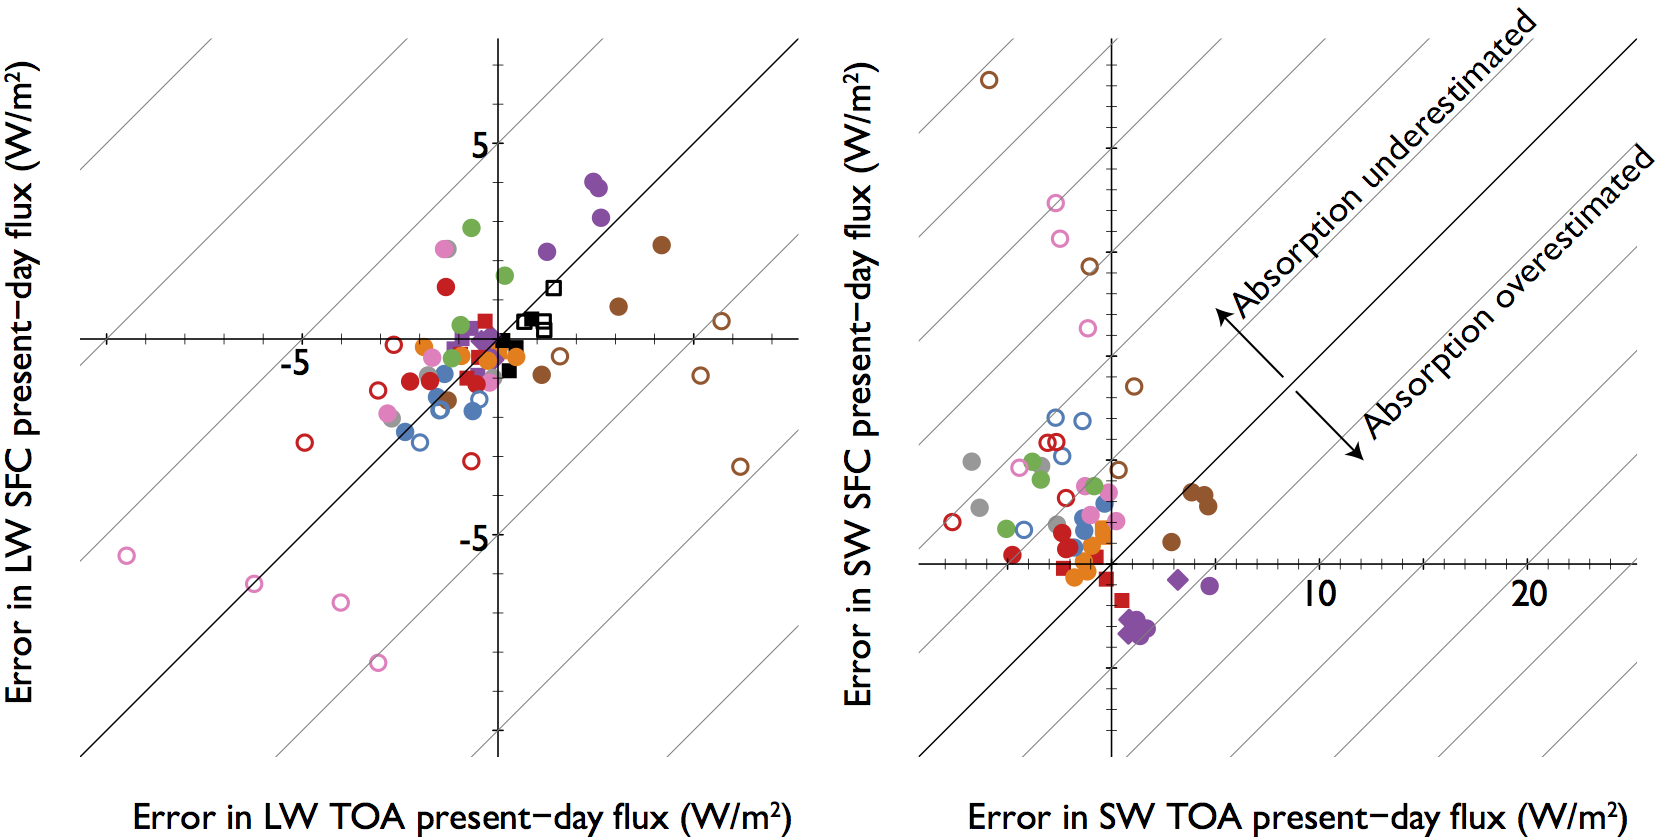
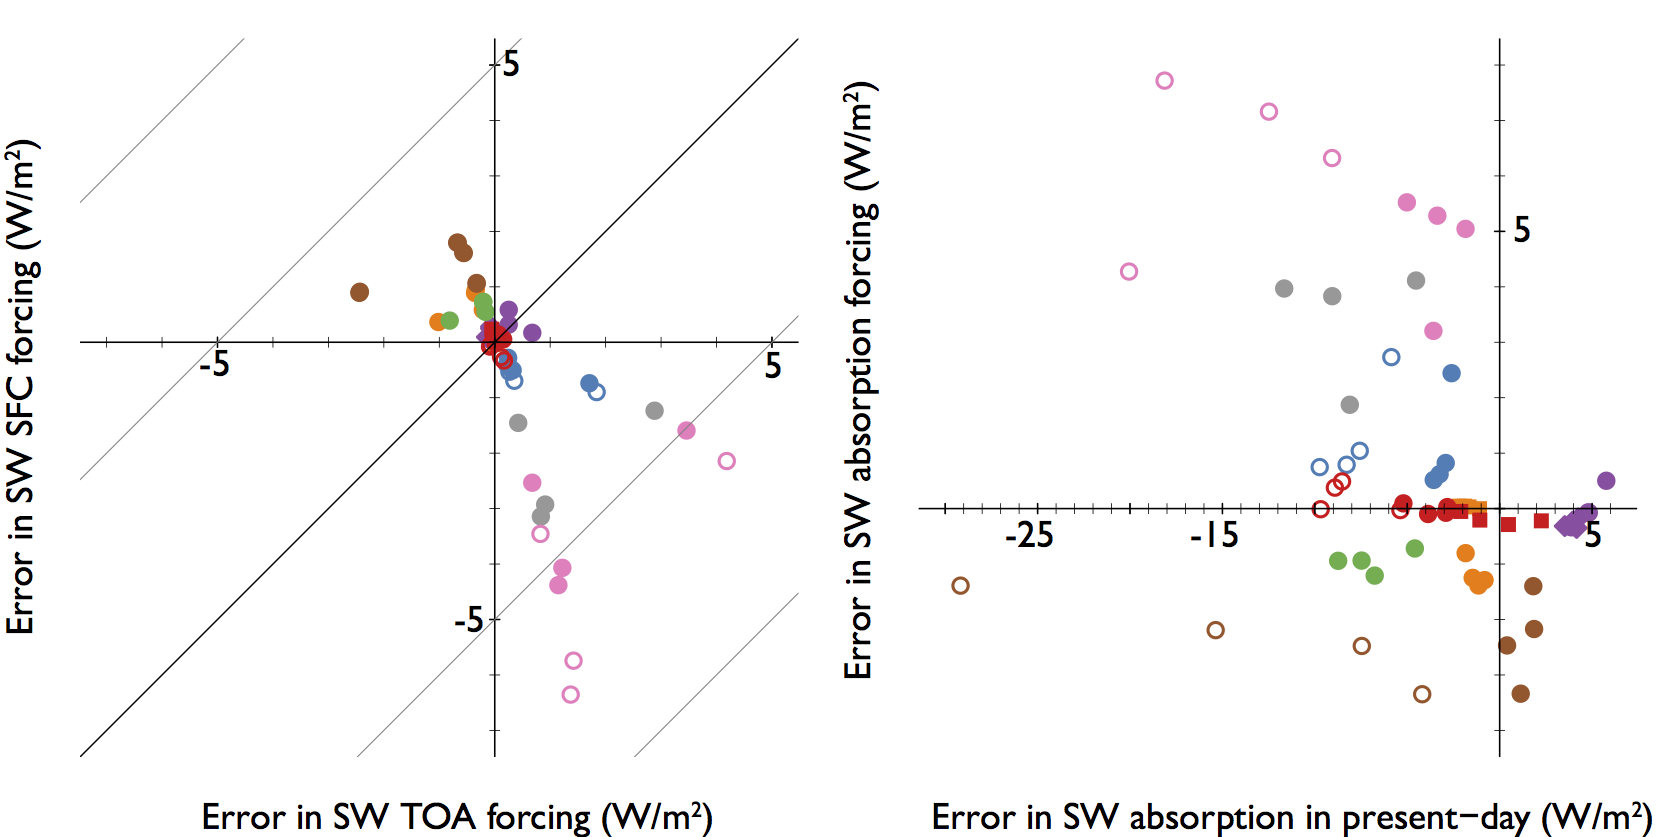
Radiative Parameterization Errors in Present-Day and Future: Implications for climate change projections

Print / PDF
Powerpoint Slide
Science
Data visualization - described in caption.
(left) Errors in top-of-atmosphere net downward broadband longwave flux under present-day conditions and (right) error in forcing from CO2 concentrations quadrupled from present-day values for a variety of reference models (squares) and parameterizations used in climate models (circles). Calculations for four atmospheric profiles are ordered by column-integrated water vapor ranging from 0.32 to 4.85cm. Histograms along the right edge of each panel show the error by model type (black for reference models, dark grey for current parameterizations, and light grey for parameterizations used in CMIP5; normalized across model categories) centered on 0. Reference models agree to within fractions of a percent in most calculations. Parameterization error is larger but still modest, with error in some parameterizations depending strongly on the water vapor path. Parameterizations that have been updated since CMIP5 are more accurate than their predecessors (compare filled circles and dark histogram bars).


Data visualization - described in caption.
Errors in surface net downward (left) longwave and (right) shortwave flux in the present day as a function of errors in net top-of-atmosphere flux, along with (diagonal) isolines of constant error in atmospheric absorption inferred from fluxes at the boundary. All four cases are shown. Axis tick marks are every 1 W/m2 and absorption isolines every 5 W/m2. Errors in longwave boundary fluxes and radiative divergence are generally within a few W/m2, especially for current parameterizations, while errors in shortwave fluxes and absorption are twice as large.


Data visualization - described in caption.
(left) Errors in surface net downward shortwave forcing from quadrupled present-day CO2 concentrations as a function of error in net top-of-atmosphere forcing, along with (diagonal) isolines of constant error in atmospheric absorption forcing. Axis tick marks are every 1 W/m2 and absorption isolines every 5 W/m2. For many parameterizations errors in top-of-atmosphere forcing are smaller than errors in surface forcing, implying errors in absorption forcing with impacts on the host model's hydrologic cycle. (right) Error in solar absorption forcing as a function of error in the present-day estimates of solar absorption. Parameterizations have characteristic relationships among present-day and forcing errors that outweigh the impact of atmospheric state. Errors in the present day are a poor predictor of errors in forcing.


Point of Contact
Robert Pincus
Institution(s)
University of Colorado - Cooperative Institute for Research in Environmental Sciences (CIRES)
Funding Program Area(s)
Publication