
Relative Contributions of Mean-State Shifts and ENSO-Driven Variability to Precipitation Changes in a Warming Climate
Investigate how regional precipitation (P) in the 21st century may be affected by changes in both ENSO-driven P variability and slowly-evolving mean P.
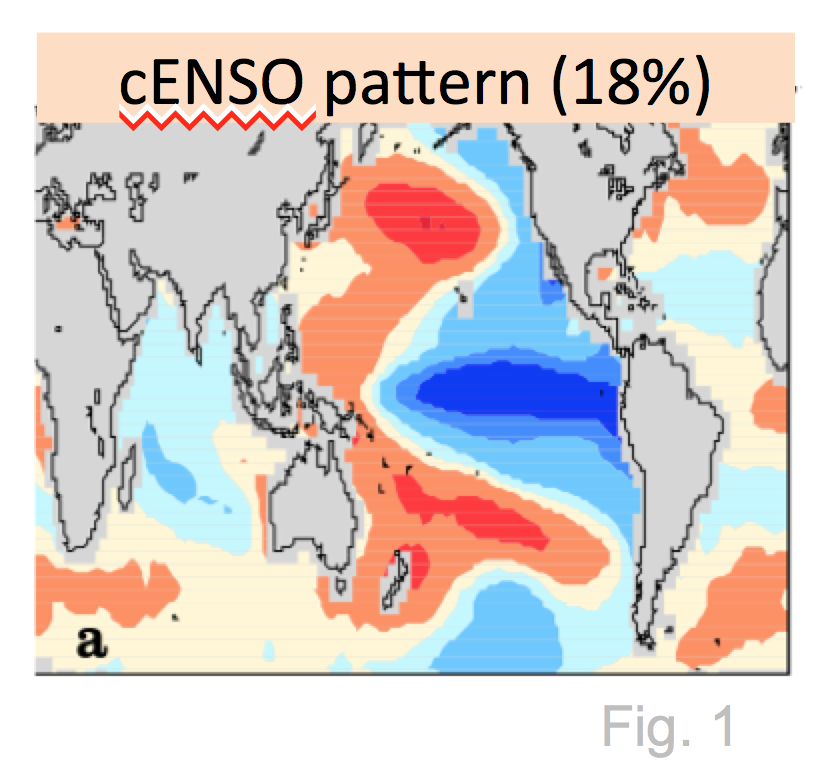
- Identify a time-invariant canonical ENSO (cENSO) pattern in observed SST data (Fig. 1).
- Evaluate how well/when 33 coupled models replicate this pattern in simulations of the historical and future climate.
- Compute the associated winter P responses to ENSO variability for the 20th century.
- Assess whether these P responses change with global warming.
- Models with better representation of the cENSO pattern produce more realistic winter P teleconnection patterns.
- Teleconnections are more stationary during the 21st century in simulations with large amplitude of cENSO variability (Fig. 2).
- In most regions, ENSO-driven P response will intensify in the future (Fig. 3), even if ENSO remains unchanged.
- The model-predicted 21st century rainfall response to cENSO are decomposed into a 3-term sum. By examining the 3 terms jointly allows the identification of regions likely to experience future rainfall anomalies that are without precedent in the current climate (Fig. 4).
The El Niño-Southern Oscillation (ENSO) is an important driver of regional hydroclimate variability through far-reaching teleconnections. Understanding the changes in ENSO-driven precipitation (P) variability in a warmer climate is however challenging for at least two reasons. First, there is considerable model disagreement in projected 21st century changes in the spatial structure and amplitude of ENSO. Second, there are also large uncertainties in how ENSO-mediated tropical and extratropical P responses are influenced by GHG-induced changes in the mean state, even if the spatial and temporal characteristics of ENSO are unaltered in the future climate. Céline Bonfils and her colleagues from the Program for Climate Model Diagnosis and Intercomparison (PCMDI) at Lawrence Livermore National Laboratory, NASA/GISS and NOAA investigated the latter question, and found that the ENSO-driven P variability is projected to intensify in many regions of the world, even in absence of a change in cENSO amplitude.
For their investigation, the researchers identified a time-invariant, canonical ENSO (cENSO) pattern in observed SST data and evaluated the fidelity with which today’s coupled ocean-atmosphere global climate models (OAGCMs) represent the spatial structure and temporal variability of this pattern in simulations of 20th century climate change. Models with better representation of the observed structure of the cENSO pattern produce winter rainfall teleconnection patterns that are in better accord with 20th century observations and more stationary during the 21st century. The authors also 1) evaluated when the OAGCMs replicate this cENSO pattern in simulations of the historical and future climate; 2) computed the associated winter P responses to ENSO variability for the 20th century; and 3) assessed whether the ENSO-driven P responses will change with global warming.
Thanks to this analysis, the model-predicted 21st century rainfall response to cENSO is decomposed into the sum of three terms: 1) the 20th century precipitation response to the cENSO pattern; 2) the additional rainfall response to cENSO in the future, which amplifies rainfall extremes; and 3) the 21st century change in the mean state of precipitation. By examining the three terms jointly, this conceptual framework allowed the authors to identify key regions likely to experience future rainfall anomalies that are without precedent in the current climate.
We acknowledge the World Climate Research Programme’s Working Group on Coupled Modelling, which is responsible for CMIP, and we thank the climate modeling groups (listed in Table S1 of this paper) for producing and making available their model output. For CMIP the U.S. Department of Energy’s Program for Climate Model Diagnosis and Intercomparison provides coordinating support and led development of software infrastructure in partnership with the Global Organization for Earth System Science Portals. CMIP5 data processing was enabled by the CDAT analysis package. A. Dai (University at Albany) calculated the second PC of the PDSI dataset (as in Fig. 2d). This work was supported by the Earth and Environmental Systems Sciences Division (EESSD) and the Regional and Global Modeling Analysis (RGMA) Program of the U.S. Department of Energy (DOE) Office of Science and was performed under the auspices of the U.S. DOE Lawrence Livermore National Laboratory (Contract DE-AC52-07NA27344). K.M. was supported by a Laboratory Directed Research and Development award (13-ERD-032). C.B. was fully supported by the DOE/OBER Early Career Research Program Award SCW1295. We thank our three reviewers for their very helpful and constructive comments, which have substantially improved our paper.